LUMBER WEIGHT REFERENCE
Wood species weight examples: 30 common selections
Compare domestic hardwoods, softwoods and imported decking with documented reference densities and actual board dimensions.
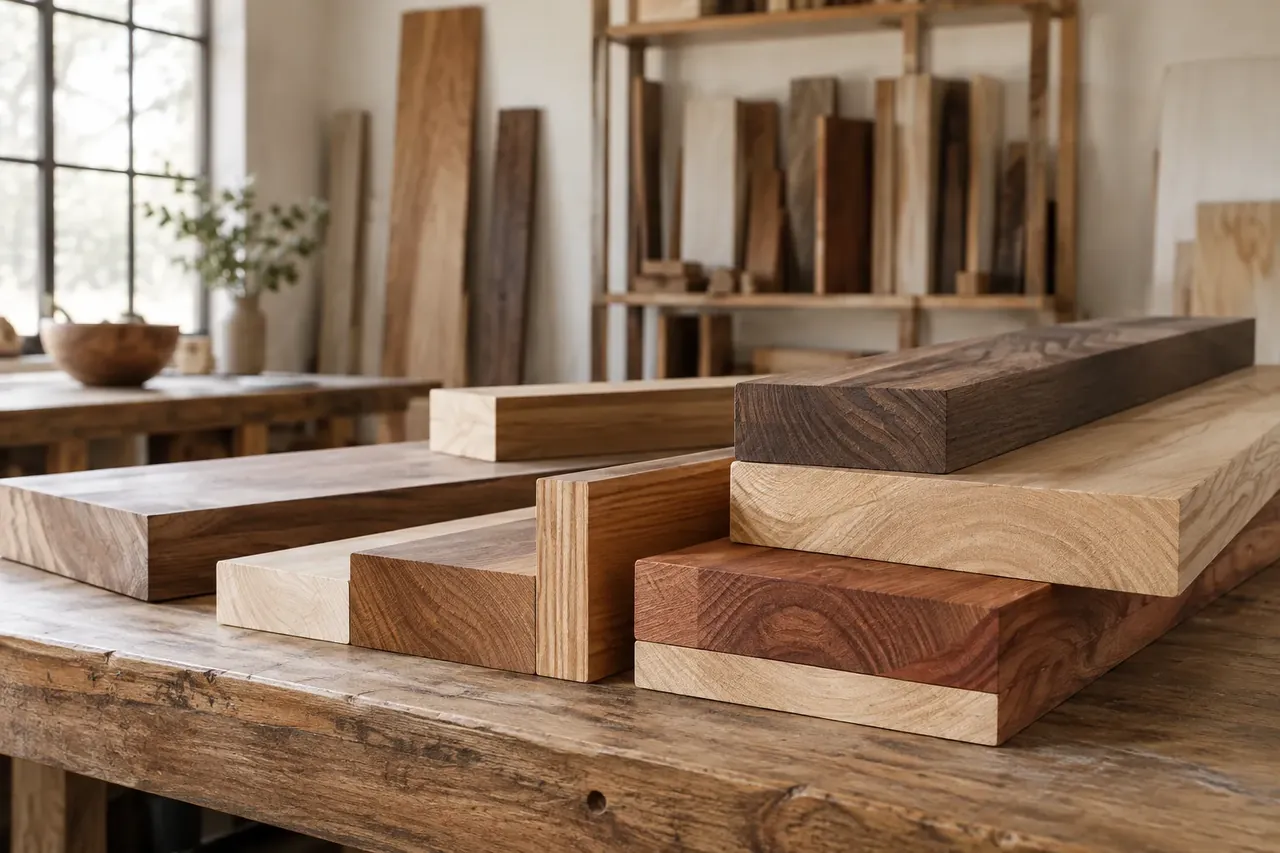
ONE BOARD · SIX REFERENCE WEIGHTS
Same dimensions.
Different mass.
One 8-foot board, ¾ inch thick and 5½ inches wide. These estimates use the published 12% moisture reference for each wood.
Compare all 30 woods and change the size ↗SAME SIZE · DIFFERENT WOOD
Weight examples for 30 woods used in the U.S.
Domestic hardwoods, construction softwoods and imported decking woods. This is a practical reference selection, not a sales-ranked top 30. Compare equal quantities at the stated 12% moisture reference condition.
Decking 1×6 nominal → 0.75 × 5.5 in actual (19.05 × 139.7 mm). Same rectangular geometry for every row; not a claim that each species is sold in this profile. Size reference.
| Wood | Density lb/ft³ (kg/m³) | Example lb (kg) | Evidence |
|---|---|---|---|
| American beechDomestic hardwood | 45720.83 | 10.314.68 | USDA average ↗12% moisture basis |
| American elmDomestic hardwood | 35560.65 | 8.023.64 | USDA average ↗12% moisture basis |
| Bald cypressSoftwood | 32512.59 | 7.333.33 | USDA average ↗12% moisture basis |
| BasswoodDomestic hardwood | 26416.48 | 5.962.7 | USDA average ↗12% moisture basis |
| Black cherryDomestic hardwood | 35560.65 | 8.023.64 | USDA average ↗12% moisture basis |
| Black spruceSoftwood | 29464.54 | 6.653.01 | USDA average ↗12% moisture basis |
| Black walnutDomestic hardwood | 38608.7 | 8.713.95 | USDA average ↗12% moisture basis |
| Coast Douglas-firSoftwood | 34544.63 | 7.793.53 | USDA average ↗12% moisture basis |
| CumaruImported hardwood | 66.81,070 | 15.316.94 | Study sample ↗12% moisture basis |
| Eastern hemlockSoftwood | 28448.52 | 6.422.91 | USDA average ↗12% moisture basis |
| Eastern white pineSoftwood | 24384.44 | 5.52.49 | USDA average ↗12% moisture basis |
| GarapaImported hardwood | 49.32790 | 11.35.13 | Study sample ↗12% moisture basis |
| IpeImported hardwood | 65.551,050 | 15.026.81 | Study sample ↗12% moisture basis |
| Northern red oakDomestic hardwood | 44704.81 | 10.084.57 | USDA average ↗12% moisture basis |
| Ponderosa pineSoftwood | 28448.52 | 6.422.91 | USDA average ↗12% moisture basis |
| Red pineSoftwood | 31496.57 | 7.13.22 | USDA average ↗12% moisture basis |
| RedwoodSoftwood | 28448.52 | 6.422.91 | USDA average ↗12% moisture basis |
| Shagbark hickoryDomestic hardwood | 50800.92 | 11.465.2 | USDA average ↗12% moisture basis |
| Shortleaf pine (Southern Pine)Softwood | 36576.66 | 8.253.74 | USDA average ↗12% moisture basis |
| Sitka spruceSoftwood | 28448.52 | 6.422.91 | USDA average ↗12% moisture basis |
| Sugar maple (hard maple)Domestic hardwood | 44704.81 | 10.084.57 | USDA average ↗12% moisture basis |
| SweetgumDomestic hardwood | 36576.66 | 8.253.74 | USDA average ↗12% moisture basis |
| Western hemlockSoftwood | 29464.54 | 6.653.01 | USDA average ↗12% moisture basis |
| Western larchSoftwood | 38608.7 | 8.713.95 | USDA average ↗12% moisture basis |
| Western red cedarSoftwood | 23368.42 | 5.272.39 | USDA average ↗12% moisture basis |
| Western white pineSoftwood | 27432.5 | 6.192.81 | USDA average ↗12% moisture basis |
| White ashDomestic hardwood | 42672.78 | 9.634.37 | USDA average ↗12% moisture basis |
| White oakDomestic hardwood | 48768.89 | 114.99 | USDA average ↗12% moisture basis |
| Yellow birchDomestic hardwood | 43688.79 | 9.854.47 | USDA average ↗12% moisture basis |
| Yellow-poplar (tulipwood)Domestic hardwood | 29464.54 | 6.653.01 | USDA average ↗12% moisture basis |
USDA entries use the density column in Wood (2007), Table 6.7.2, not the specific-gravity column. Ipe, Cumaru and Garapa use the sample densities in Coatings (2020), Table 2. Metric values and board weights are calculated conversions; rounded outputs do not imply precise product weights.